
BMI Chart: Healthy Weight Range by Height & Weight:
Medically reviewed by [Dr. Muhammad Sharif, FCPS, MCPS]. Last updated: October 2, 2026.
A BMI chart shows how your weight relates to your height and helps classify adult BMI as underweight, healthy weight, overweight, or obesity. For adults age 20 and older, the standard BMI categories are based on your BMI number rather than your age or sex. BMI is a screening measure, not a diagnosis, so it should be considered alongside other health information.
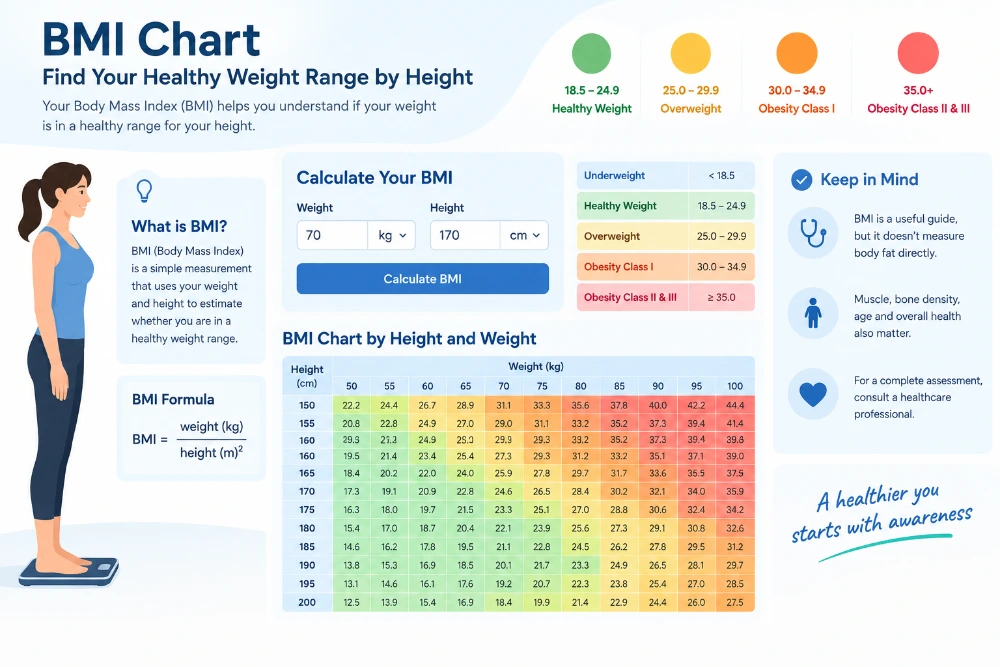
Use the chart below to find the healthy BMI range for your height, then use our BMI calculator for an exact BMI based on your height and weight.
BMI Chart for Adults:
For adults age 20 and older, the standard BMI categories are:
| BMI Category | BMI Range | General Meaning |
|---|---|---|
| Underweight | Below 18.5 | Below the standard healthy-weight range |
| Healthy Weight | 18.5–24.9 | Within the standard healthy-weight range |
| Overweight | 25.0–29.9 | Above the standard healthy-weight range |
| Obesity | 30.0 or higher | Above the standard healthy-weight range |
The CDC further divides obesity into Class 1 (30–34.9), Class 2 (35–39.9), and Class 3 (40 or higher).
Important: BMI is a screening tool. It does not diagnose a disease and should not be used by itself to determine whether someone is healthy.
How to Read a BMI Chart:
Reading a BMI chart is simple:
- Find your height in the height column.
- Find your current weight.
- See which BMI range your weight falls into.
- Check the corresponding BMI category.
- For an exact BMI number, use a BMI calculator.
For example, an adult who is 5’8″ and weighs 150 lb has a BMI of about 22.8, which falls within the standard healthy-weight category.
A BMI chart provides a useful reference, while a calculator gives your specific BMI.
BMI Chart by Height and Weight:
The following table shows the approximate healthy-weight range for adults, based on a BMI from 18.5 through 24.9.
| Height | Healthy Weight Range |
|---|---|
| 4’10” | 87–119 lb |
| 5’0″ | 95–128 lb |
| 5’2″ | 101–136 lb |
| 5’4″ | 108–145 lb |
| 5’6″ | 115–154 lb |
| 5’8″ | 122–164 lb |
| 5’10” | 129–174 lb |
| 6’0″ | 136–184 lb |
| 6’2″ | 144–194 lb |
| 6’4″ | 152–205 lb |
These ranges are calculated from the standard adult BMI range of 18.5–24.9.
If your height or weight isn’t listed, use our BMI calculator with your exact measurements.
What Is a Healthy Weight for My Height?
There is no single healthy weight for each height. The standard adult BMI range of 18.5 to less than 25 corresponds to a range of weights at each height.
For example:
- 5’0″: about 95–128 lb
- 5’4″: about 108–145 lb
- 5’6″: about 115–154 lb
- 5’8″: about 122–164 lb
- 6’0″: about 136–184 lb
BMI does not account for every factor that affects health, so these numbers should be treated as a screening reference rather than an individualized medical target.
Is the BMI Chart Different for Men and Women?
No. The standard adult BMI categories are the same for men and women.
For adults age 20 and older, the CDC uses the same BMI category ranges regardless of sex or age:
- Underweight: below 18.5
- Healthy weight: 18.5–24.9
- Overweight: 25–29.9
- Obesity: 30 or higher
However, BMI does not measure body-fat distribution or distinguish muscle from fat. Those factors can matter when interpreting an individual result.
Does Age Affect the Adult BMI Chart?
For adults age 20 and older, the standard BMI categories do not change based on age.However, BMI is interpreted differently for children and teenagers. People ages 2–19 are assessed using BMI-for-age percentiles, which account for age and sex. This means you should not use the adult BMI chart to interpret a child’s or teenager’s BMI.
BMI Chart for Children and Teens:
Children and teenagers ages 2 through 19 use a different BMI chart. Instead of applying fixed adult BMI cutoffs such as 18.5, 25, and 30, their BMI is compared with children of the same age and sex using BMI-for-age percentiles. The CDC categories are:
| Category | BMI-for-age percentile |
|---|---|
| Underweight | Below 5th percentile |
| Healthy Weight | 5th to below 85th percentile |
| Overweight | 85th to below 95th percentile |
| Obesity | 95th percentile or higher |
Do not use an adult BMI chart to assess a child or teenager. Use our Child and Teen BMI Calculator for BMI-for-age information.
What Does BMI Percentile Mean?
A BMI percentile shows how a child’s or teenager’s BMI compares with other children of the same age and sex.
For example, a BMI at the 75th percentile means the child’s BMI is higher than that of approximately 75% of children in the reference population of the same age and sex.
BMI percentiles are used for children and teens because their bodies are still growing and BMI naturally changes with age.
Is BMI an Accurate Measure of Health?
BMI is useful as a screening measure, but it does not provide a complete picture of an individual’s health.
BMI does not directly measure body fat and does not distinguish between muscle, fat, and bone mass. It also does not show where fat is stored in the body.
For a more complete assessment, healthcare professionals may consider factors such as:
- Waist circumference
- Blood pressure
- Cholesterol
- Blood glucose
- Medical history
- Physical examination
- Physical activity and other health factors
The CDC recommends considering BMI alongside other information rather than treating it as a diagnosis.
Does BMI Account for Muscle Mass?
No. BMI does not distinguish between muscle and body fat.
Someone with substantial muscle mass may have a relatively high BMI even when they have a lower amount of body fat.
This is one reason BMI should be interpreted in context rather than used as the only measure of health.
Is BMI Different for Asian People?
The standard adult BMI categories shown above are commonly used regardless of race or ethnicity. However, some clinical guidelines use lower BMI thresholds for certain ethnic groups because cardiometabolic risk can occur at lower BMI levels.
For example, NICE recommends practical thresholds of 23 kg/m² for overweight and 27.5 kg/m² for obesity for people from South Asian, Chinese, other Asian, Middle Eastern, Black African, and African-Caribbean backgrounds in the context of its overweight and obesity guidance.
These thresholds should not be confused with the standard adult BMI categories. Different guidelines and clinical situations may use different thresholds.
If you’re from a population for which lower BMI thresholds are recommended in your healthcare system, discuss your BMI with a healthcare professional.
Can You Use a BMI Chart During Pregnancy?
BMI charts are not designed to assess weight status during pregnancy.
Pregnancy causes normal changes in body weight and composition, so a standard adult BMI chart should not be used to judge whether a pregnant person has a healthy weight during pregnancy.
If you are pregnant or recently gave birth and have questions about weight, discuss your individual situation with your healthcare provider.
Limitations of a BMI Chart:
A BMI chart is useful for screening, but it has limitations.
BMI does not measure body fat directly:
BMI is calculated from height and weight. It does not directly measure how much body fat someone has.
BMI does not distinguish muscle from fat:
People with higher muscle mass can have a higher BMI without having the same body-fat level as someone with less muscle.
BMI does not show where fat is stored:
BMI does not tell you whether fat is concentrated around the abdomen or elsewhere. Other measurements, such as waist circumference, can provide additional information.
BMI is not a diagnosis:
A BMI category is a screening result, not a diagnosis of a medical condition.
Children use different BMI charts:
Children and teens need BMI-for-age percentiles rather than adult BMI categories.
Frequently Asked Questions About BMI Charts:
Q-1 :- What is a BMI chart?
Ans: – A BMI chart shows BMI ranges and their corresponding weight categories based on height and weight. For adults, standard categories are underweight, healthy weight, overweight, and obesity.
Q- 2 :-What is a healthy BMI range?
For adults age 20 and older, the standard healthy-weight BMI range is 18.5 to less than 25.
Q- 3 :-What BMI is considered overweight?
For adults, a BMI from 25.0 to less than 30.0 falls in the overweight category under the standard CDC adult classification.
Q- 4 :-What BMI is considered obesity?
For adults, a BMI of 30.0 or higher falls in the obesity category under the standard CDC classification.
Q- 5 :-What BMI is considered underweight?
For adults, a BMI below 18.5 falls in the underweight category.
Q- 6 :-Is BMI the same for men and women?
Yes. The standard adult BMI categories are the same for men and women.
Q- 7 :-Does age change the adult BMI categories?
No. For adults age 20 and older, the standard BMI categories do not change according to age. Children and teens are assessed using BMI-for-age percentiles.
Q- 8 :-Can I use an adult BMI chart for my teenager?
No. Children and teenagers ages 2–19 should be assessed using BMI-for-age percentiles based on age and sex.
Q- 9 :-Can BMI be high if I am muscular?
Yes. BMI does not distinguish muscle from fat, so a person with substantial muscle mass may have a higher BMI.
Q- 10 :-Can you have a normal BMI and still have health risks?
Yes. BMI is only one health indicator and does not capture every aspect of health, including body-fat distribution and some other risk factors.
Q- 11 :-Is BMI different for Asian people?
Some clinical guidelines use lower BMI thresholds for certain Asian populations in specific clinical contexts. The standard adult BMI categories and these population-specific thresholds should not be treated as interchangeable.
Check Your Exact BMI:
A BMI chart gives you a quick reference based on height and weight.
For an exact result, use our BMI Calculator. Enter your height and weight in US or metric units to calculate your BMI and see the corresponding category.
Sources:
- Centers for Disease Control and Prevention —> Adult BMI Categories
- Centers for Disease Control and Prevention —> About BMI
- Centers for Disease Control and Prevention —> Child and Teen BMI / BMI-for-Age guidance